Delfland improves water quality
Using data science and the latest cloud technologies to analyse water systems
At Royal HaskoningDHV Digital, we deal with data-driven projects every day, and there’s one problem we come across a lot within the organisations we work with – a lack of clear policies to guarantee data quality.
In this blog post, we’ll provide an example of how expert data engineers and the latest cloud technologies can help you ensure the quality of your data, using one of our clients – the Delfland water authority – as an example.
In this blog post, we’ll provide an example of how expert data engineers and the latest cloud technologies can help you ensure the quality of your data, using one of our clients – the Delfland water authority – as an example.
Bringing automation to water management
How we used quality rules to simulate manual testing
The data visualisations that can identify problems at a glance
A complicated undertaking
One of 25 water authorities in the Netherlands, Delfland has to perform a Water System Analysis (WSA) every six years to ensure water meets the quality standards laid out by statutory regulations.Historically, the process took Delfland a long time. Data had to be manually collected from a ledger containing all the separate elements of the system, from weirs and culverts to pumping stations and so on.
The process of manually searching for this data was also error prone. And if the data proved to be incorrect, it couldn’t be modelled as part of the WSA assessment. Which meant valuable time was often spent with no meaningful return.
Delfland needed to take control of its data quality and accelerate the process of gathering and analysing its data. So, the water authority turned to us for assistance.
Automating data collection and modelling
To help Delfland’s management team improve both efficiency and data accuracy, we designed a new system that automatically checks current data, future data and new measurements by subjecting it to a group of quality rules.These rules are based on expert knowledge and simulate the manual tests hydrologists would perform themselves. However, in automating these tests and removing any potential for human error, the system guarantees the accuracy of the results, meaning no time is lost identifying and updating incorrect values when conducting the WSA.
We then expanded this system with extra rules for the data management team, allowing them to check aspects that aren’t necessarily important for a WSA, but can still provide important insights – like the position of a weir on the boundary of two water level areas, for instance.
Together, this package of rules provides an overview of Delfland’s entire data management system, delivering visualisations through Microsoft Power BI so engineers and managers can identify problems at a glance and take the necessary actions to rectify them.
In addition to this, we also built a new data pipeline, that ensures any new data is in accordance with existing requirements. This information is then automatically complied into a report that shows which data can be safely included in the new system.
The benefits of change
With the new system, Delfland has greater control over its data, can gather it much more quickly, and has far simpler processes to help manage and analyse it.The result is that hydrologists now have the insights into data quality they need to identify and mitigate problem areas, while managers can track changes over time with easy to interpret visualisations.
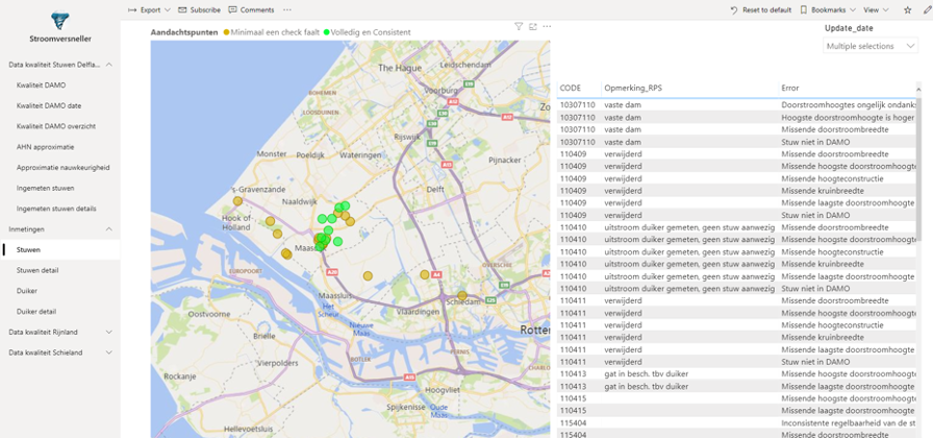
The image below, showing an example of a dashboard for newly measured weirs, is a good example of this. The dots in the map on the left illustrate data quality. While the table on the right shows all the problems the system has identified.
Our work with Delfland didn’t just extend to the new data quality system. The company also wanted to explore the potential of using the Microsoft Azure public cloud to bring new levels of efficiency to its data projects.
Before, Delfland’s systems ran on a hybrid cloud, with data in different systems proving difficult to access. Using Azure Data Factory, we provided a safe and simple solution to help Delfland migrate all necessary data to the public cloud. Once there, it’s automatically subject to quality rules to ensure governance.
What’s more, the new system is completely serverless, which means Delfland only has to incur extra expense as and when more resources are needed.
If you’d like to learn more about how data engineering can improve data quality – or about the possibilities of Microsoft Azure – don’t hesitate to get in touch with one of our experts.
Before, Delfland’s systems ran on a hybrid cloud, with data in different systems proving difficult to access. Using Azure Data Factory, we provided a safe and simple solution to help Delfland migrate all necessary data to the public cloud. Once there, it’s automatically subject to quality rules to ensure governance.
What’s more, the new system is completely serverless, which means Delfland only has to incur extra expense as and when more resources are needed.
The first step on your data journey
Ensuring you have control over the quality of your data is the first step on the road to enhanced data management, but technology and tools can’t guarantee this on their own. First and foremost, it requires organisational change and a culture dedicated to taking ownership of data and its quality.If you’d like to learn more about how data engineering can improve data quality – or about the possibilities of Microsoft Azure – don’t hesitate to get in touch with one of our experts.
Digital Twins for Wastewater Infrastructure
Discover the vital role digital twins will play in the future of wastewater management.


Stayupdated
Keeping up to date with the latest digital twin news? We've got you covered